If you frequently need to do opinion surveys or create infographics, you’ll already know full well that the worst part is examining the trends and displaying the results graphically. To that end, the online service Survmetrics has taken it upon itself to facilitate these tasks, allowing you to create surveys in a very simple way, adapting them to web browsers and automatically analyzing the answers for you.
Survmetrics is a truly useful platform for anyone who works with data, stats, or other essential information, as it adapts to any type of questionnaire, offering several types of questions and answers with the enormous advantage that you can combine different types into a single survey. And not just that: your surveys won’t be seen as boring rounds of questions that make your respondent lose interest. Instead they’ll have a very visual, attractive design to capture the respondent’s attention.

The first step to enjoying this service is to register for free with an email address, and then you’ll immediately be able to create your first questionnaire: select the title, insert your business’s logo, and customize the colors, fonts, and backgrounds you want to use. Survmetrics will put together an attention-grabbing design that takes care of everything down to the smallest detail, with several styles and 150 different themes.
Once you’ve done this, you should add each question from the menu to the left of the Survmetrics interface as if they were Microsoft Power Point slides. Each time you click on “New question” a tab will drop down with eight kinds of question types: multiple choice (with and without images), scale-from-one-to-five questions, star ratings, emotional states, and open-response. The best thing? There are no limits to the number of questions.
When you’ve finished creating all the questions you can save the project by clicking on “Finished editing” and share it via email, Facebook, Twitter, QR Code, or embedding; you can check the evolution of your samples as they appear from the main menu at Survmetrics > My surveys and click on “Results” for each of them.

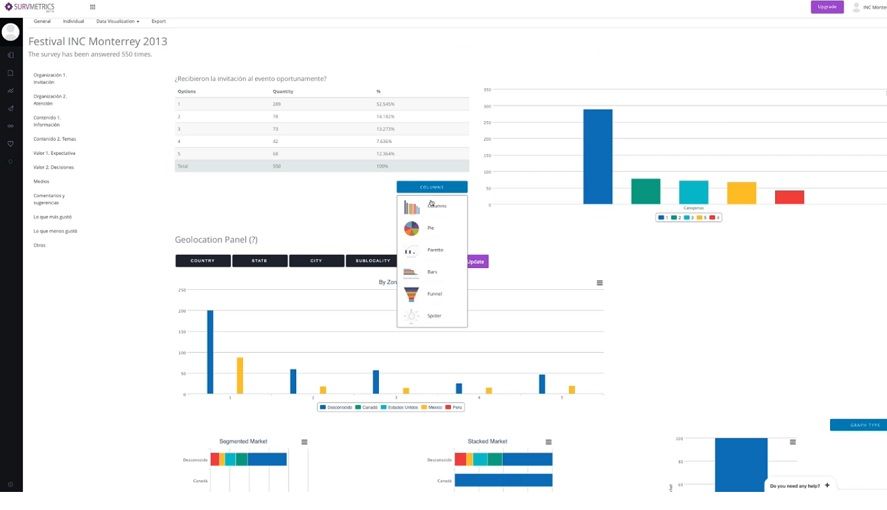
The analysis engine will examine the answers and display all the information with seven different types of graphics: column, pie, bar, pareto, funnel, and radar, and also includes a geo-referencing panel with the country, state, city, and constituency, which you can also view with five different types of displays.
Thanks to this feature you can forget about the manual recounts and graphics design, you only have to worry about asking good questions and the platform will compare your data using geolocation, evaluating each answer individually. In addition, although you can’t export all your data to Excel documents with a free account, it is indeed possible to download all the graphics in JPEG, PNG, PDF, or SVG format.


niccccceeeee