The art of the bowel movement is as fundamental as it is gross when it comes to sharing experiences. But in certain circumstances – related to your health, fool, get your mind out of the gutter! – it can be useful to keep a log of the nature and circumstances surrounding each, erm, deposition. The case of PoopLog takes this to rather worrisome levels in terms of specifying all sorts of poo-related details that you can later display as exportable graphs or statistical tables.
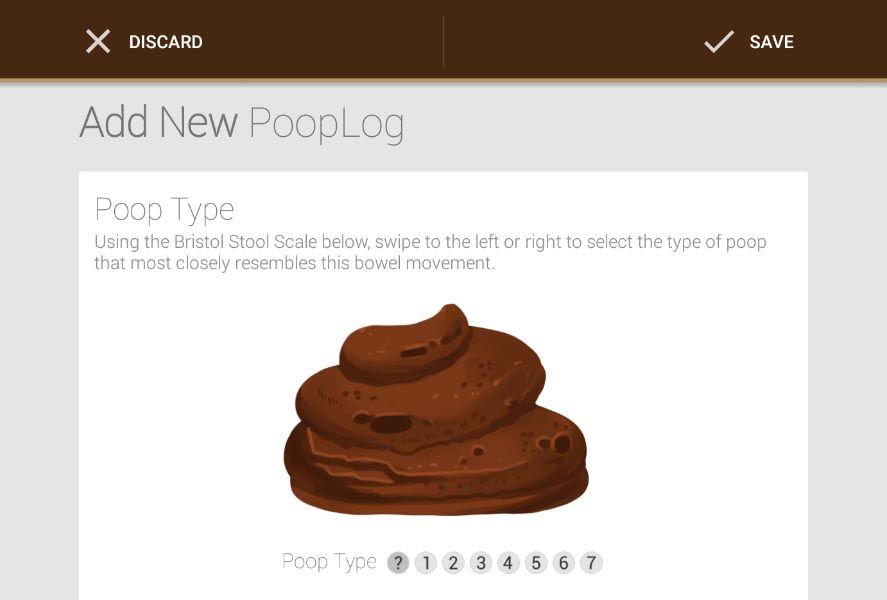
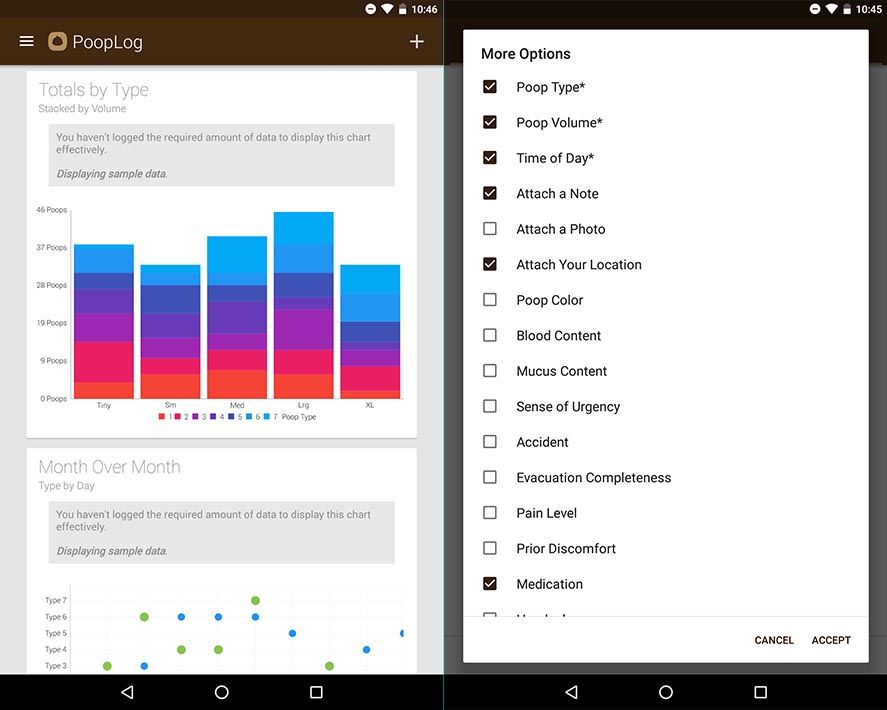
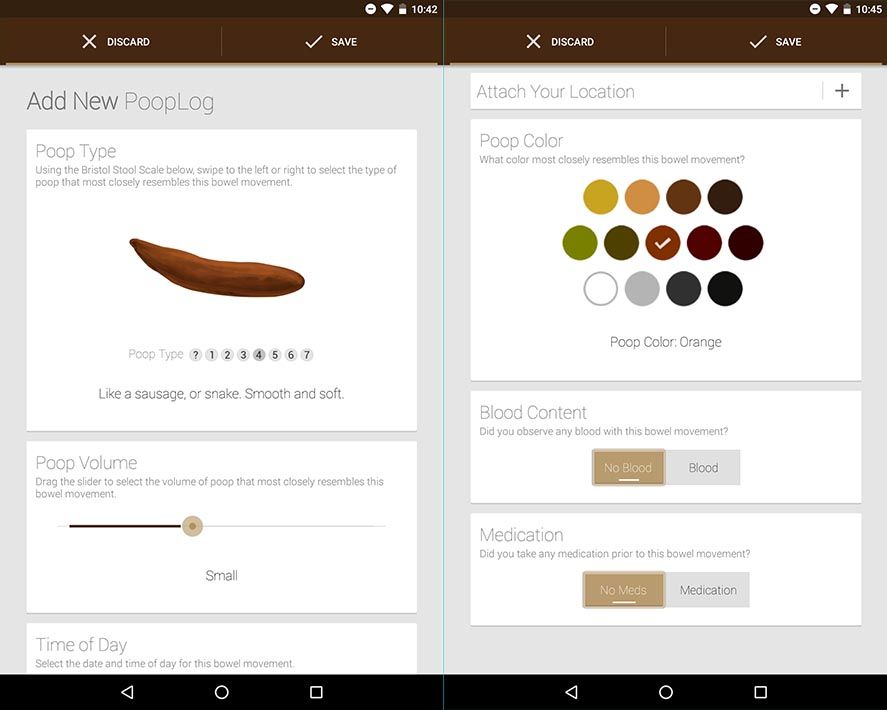
Whenever you make a new entry in your defecation diary you can specify the shape, size, color, and other aspects related to your poo. In fact, you can pick all the fields you want to fill out, ranging from the use of medication during the period of defecation or the location where you actually took the poo (geolocalized, obviously), to even more sordid details that perhaps are better left to the imagination.
These data can be turned into complete statistical reports displaying the total of registered entries and expressed in graphics. Or you can export the info as plain text, in a spreadsheet, or in an HTML report that even includes the photos you’ve added to your entries in the app. Because the Internet is wonderful, there are loads of annual poop logs proudly shared by users to give you an idea of what this app can accomplish.
The application was developed by a user who had to make his own poop log so his doctor could make a clinical diagnosis of his gastric problems. To do so, turning to the standard Bristol stool scale, he decided to make this app, which was released in 2010 for the pooping pleasure of Android users and that six years later has now received a full Material Design revamp, complete with new options added to its already-long list of functionalities.